-Bill Moninger
Upper air verification of models against AMDAR observations is now available at http://
The advantage of this kind of verification is it provides obs-model comparisons every hour, rather than the twice-a-day RAOB comparisons we have done previously.
The major disadvantage is that the AMDAR in-situ data against which the models are compared is highly nonuniform in space and time. For instance, here is the AMDAR coverage over N. America for 06-07 UTC on Thur 30 May (from http://
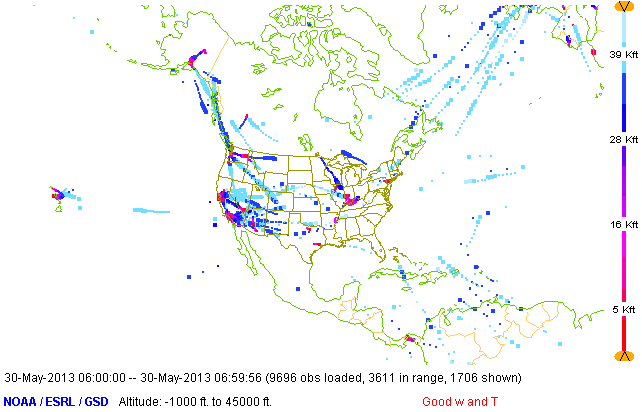
...and here is the coverage for 00-01Z that day:
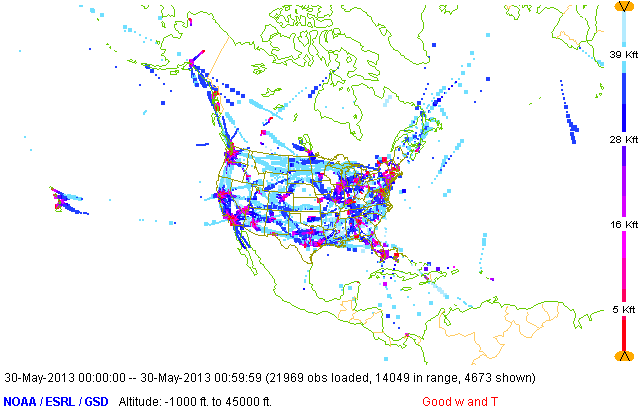
Clearly, there is much more uniform coverage at the evening (local) time.
This can lead to misleading results if the information isn’t used carefully. For instance, here is a plot of average model temperature between 100 mb and 1000 mb for the last several days:
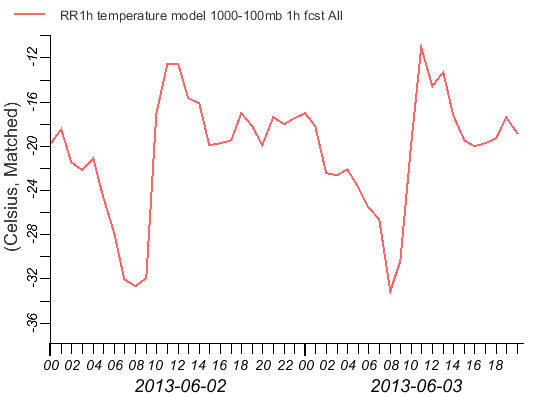
The large fluctuations in temperature suggest that the model is being sampled at different altitudes at different times of the day.
On the other hand, models can be compared with each other with some confidence, because they are compared against the same observations.
Here’s a plot of T bias (wrt AMDAR) for various RAP versions for the last several days, and for 100-300 mb (flight levels):
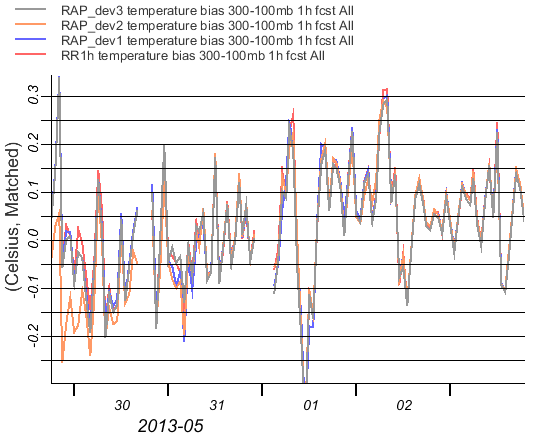
We see a substantial difference between RAP_dev2 and the other models on May 29-30, but general agreement after that. If model differences are substantial enough, they’ll show up in a matter of hours rather than a matter of days.
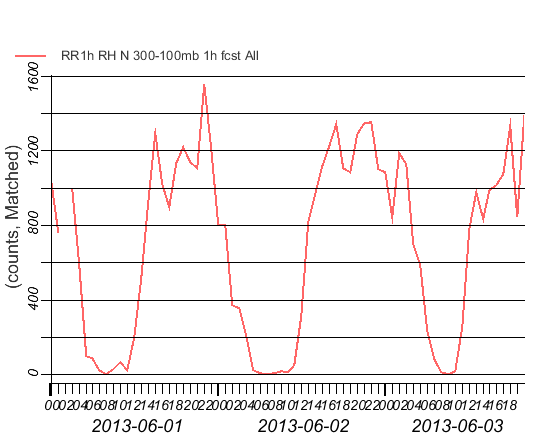
Another warning: relatively few AMDAR measure RH, so be sure to check the number of obs when you’re doing RH comparisons. Here is the number of RH comparisons over the last few days:
Time series data can be averaged in the normal ways (1, 3, 7, and 30 days) and also diurnaly. This means all data in the requested time window are mapped into 00-23 UTC:
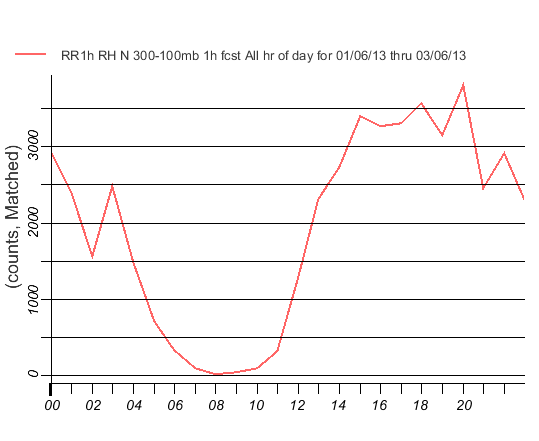
In this way, suspected diurnal effects can be averaged over many days.
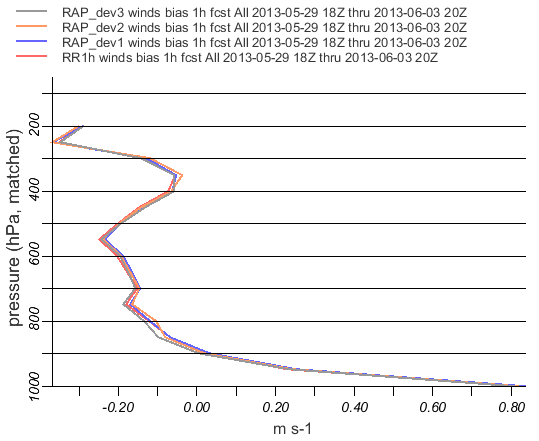
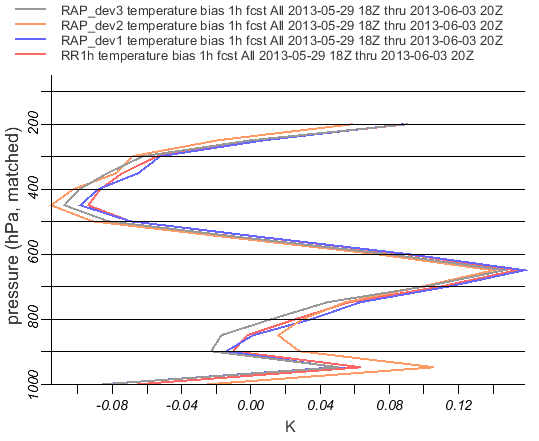
We also have profile statistics, as with the RAOB verification. Here’s wind speed and temperature bias for several models:
Separate statistics for phase-of-flight are available. These are most useful when considering a model as ‘truth’, and looking for aircraft biases. For instance, here is the temperature profile for RR1h (our production RAP) against aircraft in various phases of flight:
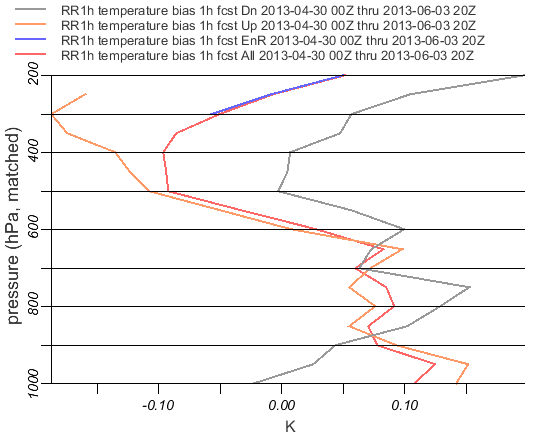
(En-route “EnR” data only appear between 200-300mb because there are too few en-route observations below these levels.)
The well-known cool bias of descents (the gray curve--more positive than the others because we’re plotting model minus ob) is evident at most levels.
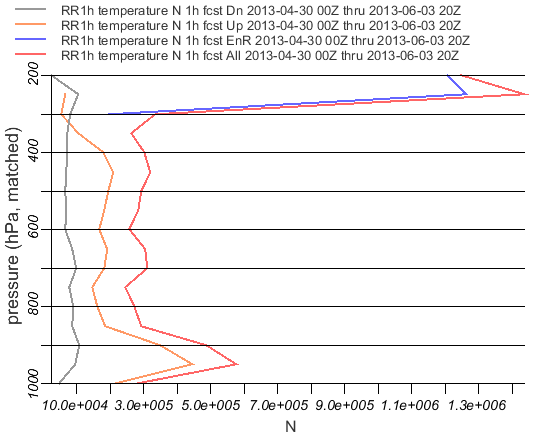
But beware, the amount of descent data is considerably less than the amount of ascent data (because of lower vertical resolution on descents), and may perhaps impact this result, though 10,000 obs per 50 mb altitude bin seems sufficient.
Currently, the only models being processed against AMDAR are RR1h, and RAP_dev{1,2,3}. We’ll take additional requests.
The web pages are available at http://